


Contents
- Bitcoin: Support, Resistance & Technical Indicators
- Ethereum: Price Prediction & On-Chain Strength
- Altcoin Accumulation & Token Unlocks
- On-Chain Metrics & Market Structure
- Macro & Sentiment Triggers to Watch
- Technical vs On-Chain: Why Both Matter
- Forecast for the Week Ahead & Expected Scenarios
- Conclusion & Key Takeaways
In this crypto market outlook, we break down what to expect in the coming week. We focus on Bitcoin support resistance, Ethereum price prediction, altcoin accumulation, on-chain metrics, and macro triggers.
Bitcoin: Support, Resistance & Technical Indicators
Key Price Levels & Patterns
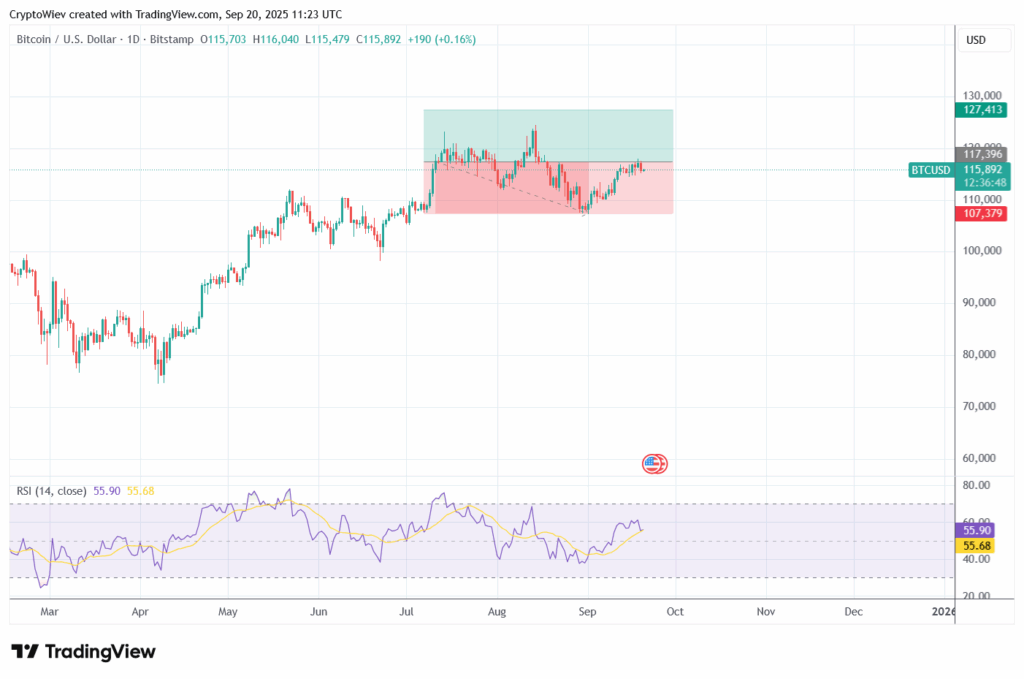
- Bitcoin (BTC) has been trading in a consolidation zone around US$115,000-US$116,000, which acts as a critical pivot region. Recent movement suggests a symmetrical triangle pattern, meaning a breakout (up or down) could yield strong directional momentum.
- On the bullish side: If BTC clears above $117,000-$118,000, this could unlock momentum toward $130,000+ levels. Resistance clusters are likely in this upper zone.
- On the downside: Support likely lies around $107,000-$110,000. A breakdown below that may risk a slide toward $95,000-$100,000 zone.
Technical Indicators & Sentiment Signals
- Volatility has eased somewhat, especially in BTC, due to increasing institutional ownership / ETF flow stability. However, thinning volumes in spot markets & more cautious futures positioning suggest fragility.
Ethereum: Price Prediction & On-Chain Strength
Price Zones & Projections
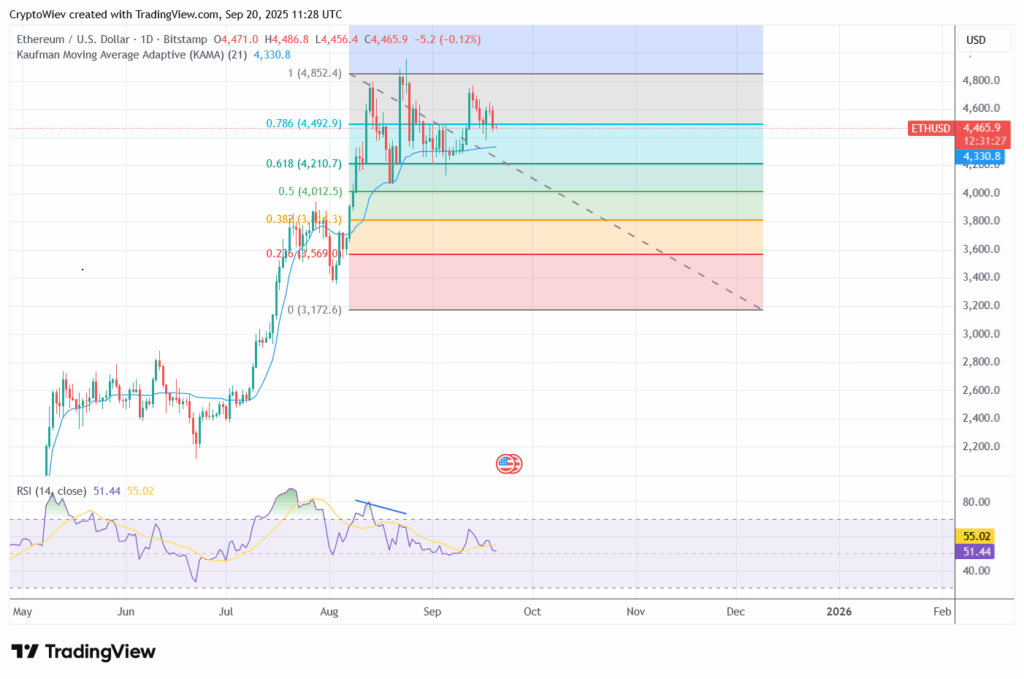
- Ethereum’s short term support is estimated in the range of $4,600-$4,400, with key resistance being tested around $4,950-$5,200.
- If ETH can decisively move beyond ~$5,000 and sustain above it, bullish continuation toward ~$5,500+ might become viable. Otherwise, a retest of lower supports could happen.
On-Chain Drivers & Layer-2 / Staking Flows
- Steady staking flows and Layer-2 adoption continue to drive demand for Ethereum, which helps with scarcity and utility.
- On‐chain metrics show some strength: active addresses, transaction volume remain reasonably healthy (though not parabolic), indicating that ETH’s usage base is not weakening significantly.
Altcoin Accumulation & Token Unlocks
Whale Activity & Altcoin Trends
- Whales have recently accumulated LINK, CRO, and TON, signalling bullish interest in these altcoins.
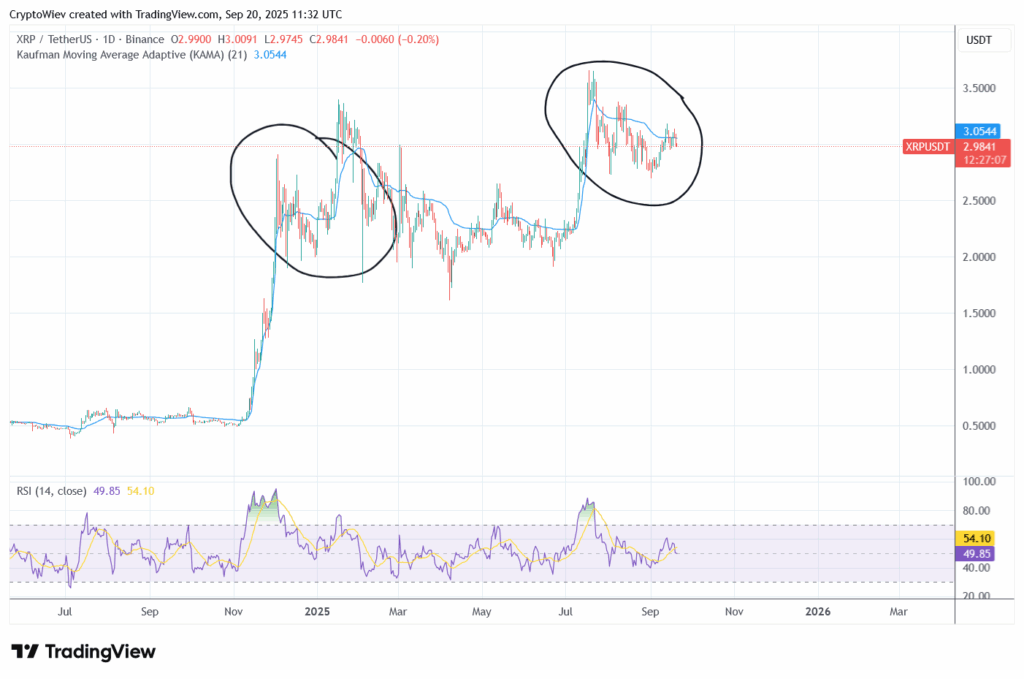
- XRP is revisiting its ~$3 support, and bulls seem still in control albeit with resistance just above ~$3.18-$3.20.
Token Unlocks & Supply Pressure
- A number of token unlock events are scheduled for September, including AltLayer, Blast, YGG, which will expand circulating supply.
- Such unlocks can temporarily increase selling pressure unless offset by strong demand or buybacks.
On-Chain Metrics & Market Structure
Bitcoin On-Chain Metrics
- Support absorption (demand): Investors appear absorbing supply in the “air gap” between ~$104K-$116K, as per recent Glassnode “BTC Market Pulse”.
- Profitability metrics (e.g., MVRV, SOPR) suggest many short-term holders are near break-even or modest profit, which tends to suppress panic selling but also limits aggressive buying unless conviction increases.
Institutional / ETF Flow & Macro Drivers
- The Fed’s rate cut (25 bps) has increased risk appetite. Markets are sensitive to incoming macro data: PCE inflation, PMI, and Fed commentary (Fedspeak).
- Institutional demand (via ETFs, corporate treasuries) continues to be a major driver. When these flows are stable or rising, they support upper bound resistance breaks.
Macro & Sentiment Triggers to Watch
- US PCE inflation data, PMI (manufacturing / services) for next week are key: they will influence expectations for further Fed rate cuts. Any surprise in inflation or labour numbers could shift sentiment dramatically.
- Announcements / developments in regulation / ETF approvals — e.g. new spot ETF filings, approvals, or altcoin ETF expansion — can cause outsized moves in specific assets.
- Global risk events: geopolitical tensions, currency stability (USD strength / weakness), and major central bank moves outside the US can ripple into crypto risk pricing.
Technical vs On-Chain: Why Both Matter
| Aspect | What Technical Analysis Shows | What On-Chain Metrics Reveal | Why Combined Gives Better View |
|---|---|---|---|
| Momentum / resistance levels | Price patterns, support/resistance zones, breakout potential | Address activity, profit/loss zones for holders, supply absorption | Helps anticipate where price is likely to go, and whether underlying interest supports such moves |
| Risk of downside | Trend reversal patterns, breakdowns from key supports | Outflows, whale distributions, weak futures/ETF flows | Warns when price moves may be fragile or unsustainable |
| Bullish continuations | Breakouts above resistance, trend strength via indicators (RSI, MACD, moving averages) | Increasing active addresses, on‐chain demand, institutional / staking inflows | Confirms that price gains are backed by real network usage and capital |
Forecast for the Week Ahead & Expected Scenarios
- Base Case (Most Likely): BTC remains in the $110,000-$118,000 range while testing resistance. ETH moves between $4,600-$5,200. Some altcoins with strong fundamentals (LINK, TON, CRO, XRP) outperform. No dramatic drop, but profit taking after resistance tests.
- Bullish Scenario: If BTC breaks above resistance (≈ $118,000), driven by strong US macro data (weak inflation or dovish Fed signals) + institutional inflows, then a move toward $130,000+ becomes plausible. ETH breaks $5,200, altcoins rally.
- Bearish Scenario: Strong inflation print, hawkish tone from Fed, or macro/global shock leads to BTC dropping toward $95,000-$100,000, ETH toward $4,200-$4,400. Altcoins suffer more; token unlocks increase supply pressure.
Conclusion & Key Takeaways
- The keyword crypto market outlook going into next week relies heavily on how Bitcoin handles its support/resistance boundaries, and whether Ethereum can break above key resistance.
- On-chain metrics indicate strength, but caution: many holders are at modest profit, and volume & demand are not explosive.
- Altcoins may provide opportunities, especially those with recent whale accumulation or upcoming supply constraints.
- Macro data—especially US inflation, PMI, and Fed commentary—will likely be the trigger for directional bias.
Not financial advice