


Key Concepts & Methodology
Before diving in, a short refresher:
- Support / Resistance are zones where price tends to pause or reverse due to demand/supply imbalances.
- These levels are not always exact lines, but zones (bands) that have been tested multiple times.
- We combine static levels (horizontal) with trend lines, moving averages, Fibonacci retracements, and on-chain data to increase conviction.
We’ll analyze Bitcoin first, then Ethereum, and finish with comparative / risk scenarios.
2. Bitcoin (BTC) Analysis
2.1 Technical / Chart Levels
From recent data:
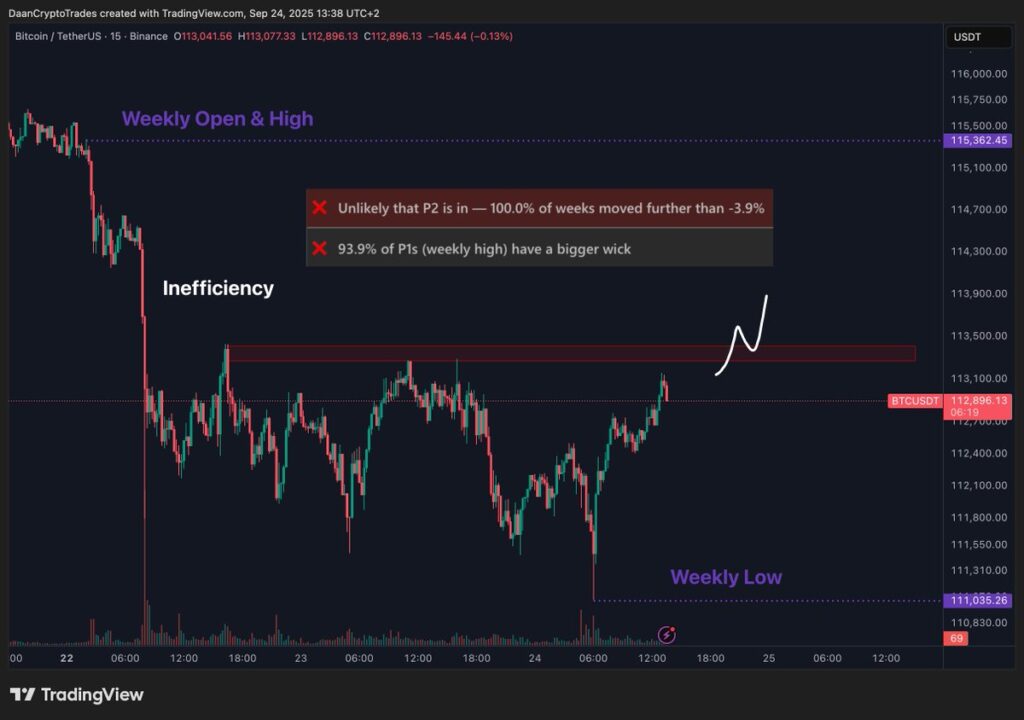
- Barchart shows Resistance levels at 113,048.96 USD, 114,082.88, 114,828.32
- Support levels: 111,269.60, 110,524.16, 109,490.24
So current price (~113,500) is sitting near an intermediate resistance zone.
We can also infer broader zones from historical swings:
| Zone | Type | Approximate Level (USD) | Notes |
|---|---|---|---|
| Resistance (minor) | resistance | ~113,000 – 114,800 | Multiple touches on Barchart levels |
| Resistance (major) | resistance | ~116,000 – 118,000 | Previous highs / upper bound of range |
| Support (near) | support | ~111,000 – 110,000 | Recent lower bounds |
| Support (strong) | support | ~105,000 – 109,000 | Historically tested band in deeper corrections |
Trend & structure:
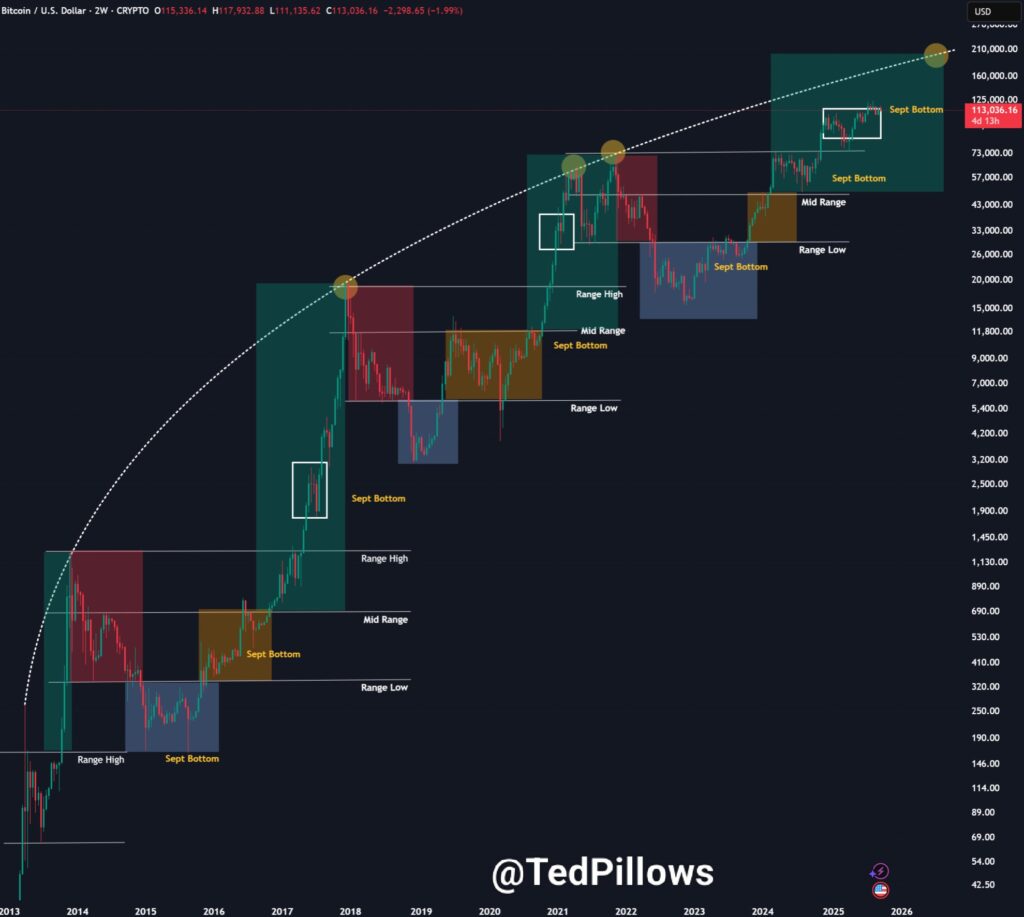
- BTC has faced resistance around 118,000 in recent runs, failing to sustain above this.
- A break above ~114,800 / 115,000 could open the way toward that high zone (116–118k).
- If it fails, a drop toward 111,000 or lower is likely. Some analysts see ~109,000 as a critical support; under that, deeper retracement may occur.
- The more times a level is tested, the stronger it becomes (touch + rejection or bounce).
Indicators to watch:
- RSI / momentum: if overbought near resistance, likely to pull back.
- Moving averages (e.g., 100 EMA, 200 MA) as dynamic support/resistance.
- Volume spikes on breakout attempts – strong volume confirms breakout validity.

2.2 On-Chain & Market Sentiment
On-chain metrics offer complementary insight:
- Platforms like CryptoQuant provide summaries of flows, exchange inflows/outflows, miner selling, etc.
- If large holders (whales) are accumulating and exchange outflows rise, that suggests more bullish backing.
- Conversely, high exchange inflows and concentrated selling from top wallets could pressure price.
At current, there is no publicly cited extreme on-chain signal pointing to imminent collapse, but sentiment is cautious around resistance zones near 114–118k.
2.3 Scenario Outlook: BTC
Bullish scenario:
- BTC breaks above ~114,800 – 115,000 with volume → next resistance band is 116,000 – 118,000.
- If that breaks, further upside is possible.
Bearish scenario:
- BTC fails to break above resistance and reverses → may test 111,000 – 110,000 support.
- If that fails, more severe correction toward 105,000 – 109,000 zone.
Watch for:
- Breakout candle + volume above resistance
- Rejection candles near resistance with bearish divergence
- Support break with weak bounce
3. Ethereum (ETH) Analysis
3.1 Technical Levels & Zones
From public commentary:
- ETH has been struggling near ~4,500 USD resistance zone.
- Lower bounds: bulls defend ~4,000 USD as a base support.
- Earlier analyses (less fresh) mentioned resistance at ~3,050 and support ~2,650, but ETH is now much above those in the current cycle.
Constructing current zone table:
| Zone | Type | Approx Level (USD) | Notes |
|---|---|---|---|
| Resistance (major) | resistance | ~4,500 – 4,750 | Seen multiple times as ceiling |
| Resistance (minor) | resistance | ~4,550 | a layered resistance just above |
| Support (near) | support | ~4,000 – 4,200 | key demand area |
| Support (strong) | support | ~3,800 – 4,000 | fallback base zone |
If ETH breaks above 4,500 decisively, bulls could push toward 4,750+ or even new highs. If rejected, the 4,000 zone is critical to hold.
3.2 On-Chain / Market Signals
- On-chain metrics (transaction volumes, gas usage, active addresses) are accessible via sources like The Block’s Ethereum on-chain data. The Block
- Rising DeFi TVL, institutional inflows, or whale stacking could support upward momentum.
- If significant selling or exchange inflows occur, downward pressure intensifies.
Currently, ETH is in a delicate battle near resistance; on-chain doesn’t point to an overwhelmingly strong trend either way.
3.3 Scenario Outlook: ETH
Bullish scenario:
- ETH breaks and holds above 4,500 USD → next targets toward 4,750+ or new highs.
- Support zones below then act as buffers.
Bearish scenario:
- ETH is rejected at resistance → retests 4,000 – 4,200 support.
- If that fails, deeper drop possible toward 3,800 or lower zones.
4. Comparative & Interplay: BTC vs ETH
- ETH often mirrors BTC’s trend but with relative strength or weakness (ETH/BTC pair). TradingView+1
- If BTC breaks upward, ETH has a better chance to sustain its breakout above 4,500.
- Conversely, if BTC weakens, ETH may struggle more severely at resistance.
Always observe volume and correlation; divergence between BTC and ETH may signal rotation or shifting sentiment.
5. Actionable Tips & Risk Management
- Use stop losses just beyond support/resistance zones to limit downside.
- Wait for confirmations (e.g. retest, candle close, volume) before entering.
- Avoid entering mid-zone – better to trade near boundaries.
- Consider partial positions to scale in/out.
- Watch macro events, news, regulatory factors – they can override technicals.
6. Summary & Final Thoughts
- Bitcoin: major resistance between 114,800 – 115,000 USD; supports at ~111,000 → deeper at ~105,000 – 109,000.
- Ethereum: facing resistance ~4,500 USD; crucial support ~4,000 – 4,200.
- A successful breakout above resistance zones opens room for further upside; failure may lead to retests of strong supports.
- On-chain metrics and volume are key confirming inputs.
- Always remain vigilant with risk control and confirmation.
Not financial advice